Post
Data Sonification. Exploring data with sound
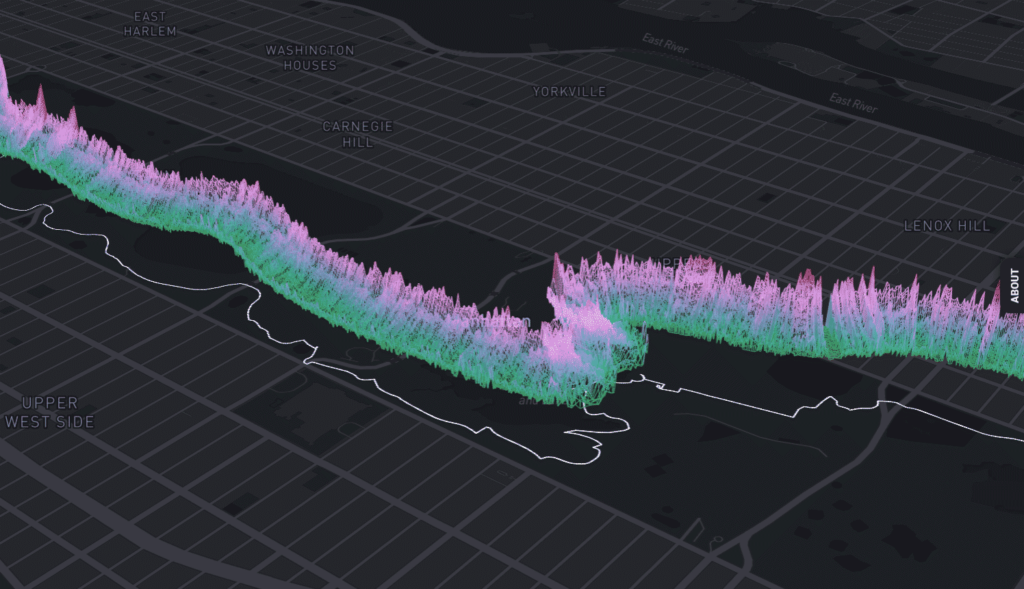
Sonic Cities – Arianna Salazar Miranda and Dylan Halpern | 2020
From Sept. 27-30 in collaboration with the Center for Design at Northeastern University (Boston, MA), “Beyond the Visual. Hearing Data Between Science and Emotion,” the first conference on Data Sonification, the representation of data through sound.
Technology is accustoming us to real “quantum leaps,” leaps into the future that make us radically change our point of view, experiences, and knowledge of our reality. But what is meant by Data Sonification?
We are immersed in an incredible amount of data. This year we are predicted to generate 79 Zettabytes of information (one zettabyte corresponds to 10000000000 Gigabytes) to touch the ceiling of 180 Zb in 2025. (*)
This incredible amount of data is an inexhaustible source of information that is of real help to us in understanding what is happening, think for example pollution data, or climate change.
But interpreting them is not easy. What tools do we have at our disposal to understand them? To make numbers into images, science relies on art.
Data visualization has allowed us to make visible the relationships between data and facts that generated them, giving us an extraordinary knowledge tool.
But a new frontier in understanding data is emerging, an even more sensitive and subtle form, capable of revealing emotionally, what the eye cannot: sound and music.
Digital enables us to hear the sound of data, the song of algorithms.
Born in science in the late 1980s, Data Sonification has been an extremely specialized field of work for a few decades, related to disciplines such as astronomy and seismology in which it has often proved useful in discovering phenomena and behaviors too complex to be visible to the human eye, but recognizable by our ear, a highly sophisticated tool when it comes to recognizing, for example, rhythmic variations or repetitions over time.
ICAD, the International Community on Auditory Display founded in 1992, is the scientific reference for those who want to use sound as an alternative or complementary method to the visual to explore large masses of data.
Alongside the scientific use. of sonification, however’ an artistic use is also asserted, in the part heir to the musical experimentation with generative methods of the 1970s. One uses data, most often related to social or political phenomena, to create immersive sound experiences for museum and gallery audiences BUT also interactive experiences for the Web. ICAD’s definition of sonification, ‘the use of nonverbal sounds to represent numerical data,’ no longer suffices.
In recent years, sonification, between a strictly scientific use for data analysis and research, and an artistic use related to musical or multi/sensory experiences, has entered the world of information design as a co-protagonist.
The design community, in search of new forms of communication that go beyond the visual to give credit to the complexity in which we live immersed, and increasingly committed to ethics and Della sostenibilità’ of its work, turns to other senses, other experiences. Data sonification becomes a new frontier to cross visual boundaries and create real data experiences.
We are waiting for you!
Oltre il visuale. Sentire i dati tra scienza ed emozione
Tuesday, September 27, 6:30 p.m.
Admission to the conference is free; registration is recommended.
You can stream the conference by logging on to the website. The meeting is commented on and moderated live.
